Electromyogram recordings in mice during vagus nerve stimulation
Acute physiological data describing muscle activation during VNS at different burst patterns and frequencies. This includes raw EMG files and quantified outcomes.
Dataset Overview
Study Purpose: Purpose of this study was to assess how acute physiological effects of vagus nerve stimulation (VNS). Throat discomfort is a therapy-limiting side effect of VNS. It is critical to understand how VNS parameter choice affects laryngeal muscle activation. Parametric testing can be used to inform parameter choice to decrease off-target effects and leveraged to build computational models.
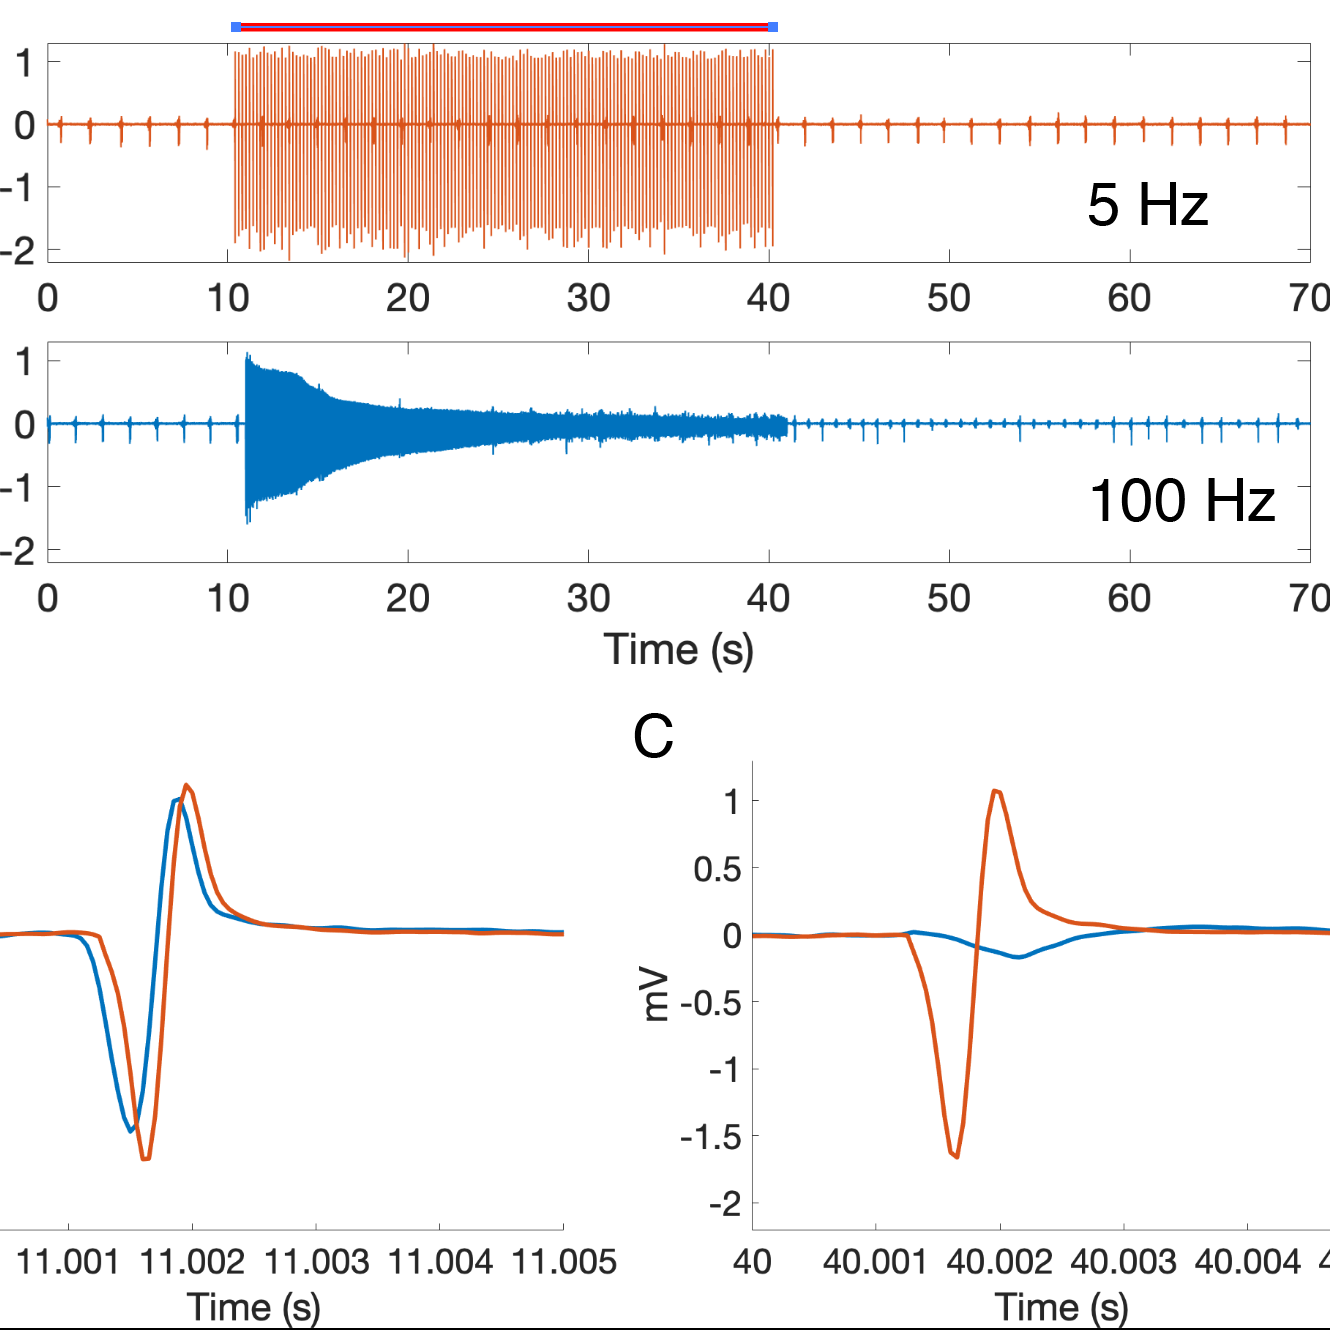
Data Collection: We performed acute in vivo experiments in anesthetized mice where we collected EMG from laryngeal muscles innervated by the vagus nerve. We designed a tested a series of constant frequency and burst patterns of stimulation. We quantified muscle activation by average rectified value of EMG.
Data Conclusion: EMG activation is primarily driven by the number of pulses applied per second and insensitive to burst frequency or stimulation amplitude (within the range of parameters tested). Amplitude effects were insignificant likely due to the low threshold for stimulation of motor fibers running through the vagus.
Curator's Notes
Experimental Design: The animals were anesthetized, and a ventral midline incision was made to access the cervical space. The right cervical vagus nerve (CVN) was isolated from the carotid artery and internal jugular vein through blunt dissection. A bipolar cuff electrode was implanted on the CVN, and stimulation and recording were controlled using custom MATLAB software. For measuring electromyographic (EMG) signals from laryngeal muscles, insulation was removed from the tips of two stainless steel wires, which were then placed under the right side of the thyroid cartilage. EMG signals were amplified with a 400x gain preamplifier (C-ISO-256, iWorx) and a 10x biopotential amplifier (ETH-256, iWorx). The signals were band-pass filtered between 10 Hz and 1 kHz and sampled at 5 kHz. Pattern order for the experiment was generated using the randperm() function in MATLAB, and subject order alternated based on sex. Each trial consisted of 10 s without stimulation for baseline assessment, followed by 30 s of VNS, and another 30 s without stimulation for recovery. Random patterns of VNS and their constant frequency controls were tested at the end of the experiment.
Completeness: This dataset is part of a larger study: "Modeling Neurotransmitter Release"
Subjects & Samples: Female (n=4) and male (n=6) adult mice (RRID:IMSR_JAX:000664) were used in the study.
Primary vs derivative data: The primary data is structured with folders, first organized by subject ID and subsequently by performance subfolders. Within each perf- subfolder, unprocessed LabChart electromyogram (EMG) signals are stored as MATLAB files. Raw LabChart .adicht files are included in the source data folder for reference. Additionally, the derivative folder contains analyzed EMG outcomes saved as MATLAB files.
Code Availability: A custom MATLAB code for data extraction and analysis is provided in the "code" folder.
Files
1 - 0 of 0 files
About this dataset
Publishing history
Cite this dataset
Tags
References
Is Supplemented by
Huffman, W., A Pelot, N., & Grill, W. (2024). Acute testing of temporal patterns of vagus nerve stimulation on physiological outcomes in mouse v1. https://doi.org/10.17504/protocols.io.5jyl8pop7g2w/v1
Described by
Huffman, W. J., Musselman, E. D., Pelot, N. A., & Grill, W. M. (2023). Measuring and modeling the effects of vagus nerve stimulation on heart rate and laryngeal muscles. Bioelectronic Medicine, 9(1). https://doi.org/10.1186/s42234-023-00107-4

Copyright © 2026 University of Pennsylvania. All rights reserved.