Quantification of enteric ganglia in the three main regions of the rat stomach
This dataset contains images and analysis used to quantify the number of neurons per ganglia, size and density of myenteric and submucosal ganglia in the rat gastric fundus, corpus and antrum.
Dataset Overview
Study Purpose: The aim of this study was to provide a quantitative account of the ganglionated plexuses of the enteric nervous system within the stomach of the rat.
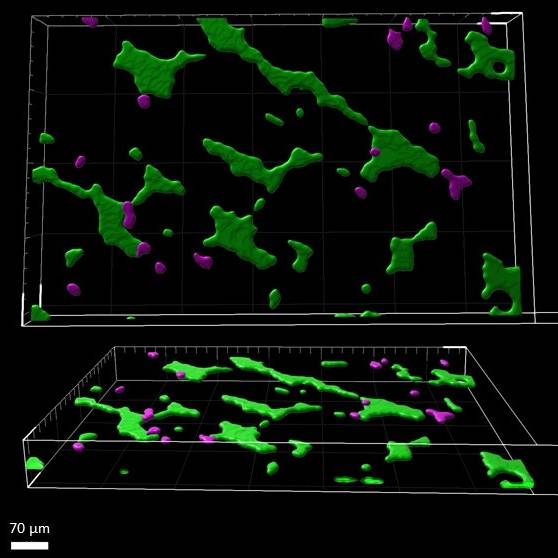
Data Collected: Enteric ganglia were visualized using immunohistochemistry for markers of neuronal cell bodies in cleared wholemounts of the stomach wall harvested from Sprague Dawley rats in a non-fasted state. Confocal microscopy was used to produce 3 dimensional images of the enteric ganglia in large regions of the stomach wall from the fundus, corpus and antrum. An algorithm was developed to segment the ganglia in three dimensions and the sizes, volumes and densities of ganglia as well as the numbers of neurons they contain were quantified and compared between regions.
Primary Conclusions: Myenteric ganglia are prominent and numerous whereas submucous ganglia are small and sparse. Myenteric ganglia in particular are larger and more sparse in the antrum and corpus than they are in the fundus. There are over 400,000 neuronal cell bodies in the rat stomach.
Curator's Notes
Experimental Design: Sprague-Dawley rats, aged 6.5-8 weeks (175-220 g for females, 220-360 g for males), were used. Experimental procedures were approved by the University of Melbourne Animal Ethics Committee. Rats were deeply anesthetized with ketamine and xylazine, transcardially perfused with heparinized phosphate-buffered saline (PBS) followed by fixative solution, and their stomachs were dissected and post-fixed. Samples were imaged as z-stack tile scans using a 10x objective on the LSM800 confocal microscope, with the upper and lower limits of the z stack chosen to include all Hu-positive staining. Image analysis was automated using the Ganglia macro.ijm script, which generated masks of immunoreactivity. Ganglia were identified as 3D objects, with a distance of greater than 20 µm separating them defined as individual regions of interest (ROI). The script was run twice with specific thresholds to capture low and high-intensity staining accurately. Manual checks were performed to remove duplications and artifacts, and ganglia were categorized as myenteric plexus (MP) or submucosa plexus (SMP) based on their position in the z stack. Measurement data were exported to Excel for further analysis, allowing for the determination of ganglia areas and the number of neurons per ganglia across different stomach regions.
Completeness: This dataset is part of a larger study:"Mapping Stomach Autonomic Circuitry and Function"
Subjects & Samples: Male (n=7) and female (n=7) adult Sprague-Dawley (RRID:RGD_8553001) were used in this study.
Primary vs derivative data: Raw microscopic images, saved as .czi files or scenes within a single .czi file, are stored in the "source" folder. The primary folder is organized by subject and sample ID, containing processed images with a macro.ijm script executed twice on each sample, each time with a different threshold, to ensure correct capture of all ganglia. These processed images are saved in .tif format. The ImageJ image calculator was utilized to generate 3D masks exclusively containing accurate ganglia-objects for the MP or SMP. These masks were then employed to produce 2D and 3D measurement data. The measurement data, along with the unique value or identifier for each ganglia-object chosen from each threshold for inclusion in the MP or SMP dataset, is recorded in the associated Excel file in the derivatives folder. Image data (JPEG2000 and OME-TIFF) was derived from the primary images (.czi). The primary images were converted to JPEG2000 (.jpx) with a 20:1 compression ratio by MBF Bioscience for web streaming and visualization on the SPARC Data Portal, with two images per subject selected for web streaming. Additionally, the primary images were converted to OME-TIFF (.tif) with lossless compression by MBF Bioscience.
Code Availability: A code written to automate the image analysis, Ganglia macro.ijm (code) is provided in the code folder.
Files
0 - 0 of 0 files
About this dataset
Publishing history
Cite this dataset
Tags
References
Is Supplemented by
Hunne, B., Furness, J., Stebbing, M., & Fothergill, L. (2021). Clearing-enhanced 3D (Ce3D) clearing method, immunohistochemistry and quantitation of rat gastric enteric ganglia v1. https://doi.org/10.17504/protocols.io.bp2l6b845gqe/v1

Copyright © 2025 University of Pennsylvania. All rights reserved.