Optical mapping of action potentials and calcium transients in the mouse heart during optogenetic stimulation of the intracardiac ganglia and interconnecting neurons (ICNS)
Optical maps describing electrical propagation across the atria and ventricles before and after stimulation of intrinsic cardiac ganglionated plexi in the mouse heart
Dataset Overview
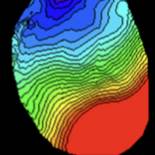
Study Purpose: To create voltage optical maps describing electrical propagation across the atria and ventricles before and after stimulation of intrinsic cardiac ganglionated plexi in the mouse heart.
Data Collection: Langendorff perfused mouse hearts loaded with voltage-sensitive dye-RH237 and Ca-sensitive dye Rhod2 AM. Simultaneous illumination and recording using dual wavelengths.
Primary Conclusion: None stated.
Curator's Notes
Experimental Design: Briefly, hearts were immobilized in a custom-built chamber to reduce motion artifact. Excitation-contraction uncoupling agents such as blebbistatin were not used. Hearts were stained with bolus injections of voltage-sensitive dye RH237 and Ca2+ indicator Rhod-2 AM into the coronary perfusate. Light from a 100-W tungsten lamp was collimated, passed through 530 ± 30 nm interference filters, split by a 560 nm dichroic mirror, and focused on the dorsal epicardial surface of the heart for excitation. Emitted fluorescence was collected with tandem camera lenses (50 mm f/1.2 mm, Nikon and 50 mm f/0.95, Navitar) and split with a 600 nm dichroic mirror. The longer wavelength moiety, containing the Vm signal, was filtered between 610-750 nm, and the shorter wavelength moiety, containing the intracellular Ca2+ signal, was filtered between 570-595 nm. The emitted fluorescence signals were recorded using 2 CMOS cameras (SciMedia, MiCAM ULTIMA) with a sampling rate of 2 kHz and 100 x 100 pixels with a 5 x 5 mm field of view. Pixel resolution of the images was 150 x 150 µm2. All simulations were performed at 10 Hz, 10 ms, and 221 mW for 10 s. Data were acquired in 40 s intervals with 15 s collected before and after the stimulation. Locations of optogenetic stimulation are detailed in the accompanying spreadsheets.
Completeness: This dataset is complete.
Subjects & Samples: Four transgenics (ChAT group RRID:MSR_JAX:014546) and two wild type (Control group RRID:IMSR_JAX:000664) male, 12 week old mice were used in this study.
Primary vs derivative data: Primary data is organized in folders by subject ID and contains LabChart (.adicht) files containing raw data for action potentials and calcium transient signals collected from optical mapping. Derivative data contains a summary spreadsheet containing voltage-calcium delay calculations derived from the raw data in the primary folder.
Files
1 - 0 of 0 files
About this dataset
Publishing history
Cite this dataset
Tags
References
Is Supplemented by
Rajendran, P., Salama, G., Zhu, C., & Hanna, P. (2020). Dual Optical Mapping of Action Potentials and Calcium Transients in the Mouse Heart during Optogenetic Stimulation of the ICNS v1. https://doi.org/10.17504/protocols.io.bcdtis6n

Copyright © 2026 University of Pennsylvania. All rights reserved.