In vivo visualization of pig vagus nerve 'vagotopy' using ultrasound
Ultrasound images of the vagus nerve from within the surgical pocket in a pig model to visualize the bimodal organization, or 'vagotopy'.
Dataset Overview
Study Purpose: This study was conducted to characterize the use of ultrasound to visualize vagus nerve fascicular organization, with the transducer placed in the surgical pocket, to improve resolution without adding significant additional risk to the surgical procedure in the pig model.
Data Collection: Data was collected using high-frequency ultrasound within the surgical pocket of the pig model, and both 2D and 3D models of the vagus nerve were reconstructed.
Primary Conclusion: The primary conclusion of this study is that ultrasound can be used to visualize the vagus nerve, and surrounding structures; though the resolution is not sufficient to directly match fasicles on a 1:1 basis with histology, it was sufficient to differentiate between motor and sensory regions.
Curator's Notes
Experimental Design: Ultrasound images were obtained from a point of known functional organization at the nodose ganglia in both cadaver and live pig subjects (n=6). All ultrasound images were collected using a Vevo® 3100 (live) or Vevo® 2100 (cadaver) high-frequency imaging system (FUJIFILM VisualSonics Inc., Toronto, Canada). The high frequency 50 MHz linear array transducer (MX700, 35 μm nominal axial resolution, 70 μm nominal lateral resolution, 9 mm × 10 mm imaging window) was placed within the surgical pocket, 1–2 mm above the VN to obtain axial cross-sections. The transducer was attached to a linear stepper motor (P/N 11484, VisualSonics Inc.) connected to the Vevo® integrated rail system to allow for the smooth acquisition of images along the length of the nerve, without the need for manual manipulation. The transducer was directed to move along the length of the VN in the cranial to caudal direction, starting at the nodose ganglion or SCG and extending the length of the surgical window (approximately 10–12 cm in length), with image collection including the typical VNS cuff location. 3-D plane-by-plane volumetric B-mode images were collected. The organization was determined from the nodose ganglion to the region of stimulating electrodes within the surgical window.
Completeness: This dataset is a part of a larger study "In vivo visualization of pig vagus nerve 'vagotopy' using ultrasound"
Subjects & Samples: Male (n=2) and female (n=4) healthy domestic (Yorkshire/Landrace crossbreed) swine were used in this study.
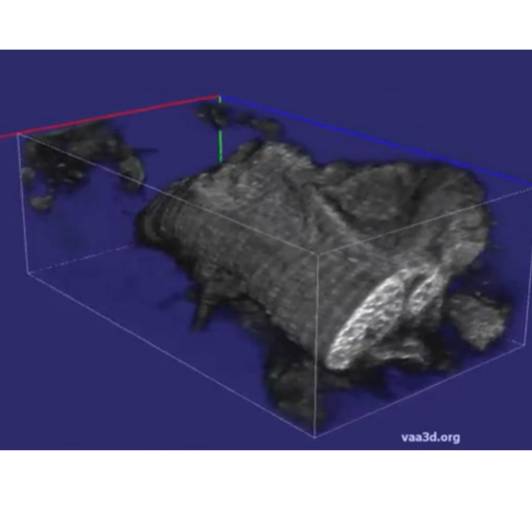
Primary vs derivative data: Primary data is organized by the subject ID herein is either raw ultrasound data or data that can be loaded into the open-source, vaa3d (http://home.penglab.com/proj/vaa3d/home/index.html#license). There is no derivative data folder.
Important Notes: This dataset is currently undergoing image registration and will be updated once this is complete.
Files
1 - 0 of 0 files
About this dataset
Publishing history
Cite this dataset
Tags
References
Is Supplemented by
Settell, M., E Knudsen, B., L McConico, A., & A Ludwig, K. (2019). Protocol for Pig Vagus Nerve Microdissection and Histology v1. https://doi.org/10.17504/protocols.io.9ieh4be
Settell, M., Chen, R., & Ludwig, K. (2022). Methods for Visualization of Pig Vagus Nerve "Vagotopy" Using Ultrasound v1. https://doi.org/10.17504/protocols.io.bp2l61m4zvqe/v1
Described by
Settell, M. L., Skubal, A. C., Chen, R. C. H., Kasole, M., Knudsen, B. E., Nicolai, E. N., Huang, C., Zhou, C., Trevathan, J. K., Upadhye, A., Kolluru, C., Shoffstall, A. J., Williams, J. C., Suminski, A. J., Grill, W. M., Pelot, N. A., Chen, S., & Ludwig, K. A. (2021). In vivo Visualization of Pig Vagus Nerve “Vagotopy” Using Ultrasound. Frontiers in Neuroscience, 15. https://doi.org/10.3389/fnins.2021.676680

Copyright © 2026 University of Pennsylvania. All rights reserved.