Distribution and coexpression patterns of specific cell markers of enteroendocrine cells in pig gastric epithelium
Describes regional differences in gastric wall structure and in the types and densities of hormone secreting cells in the pig stomach.
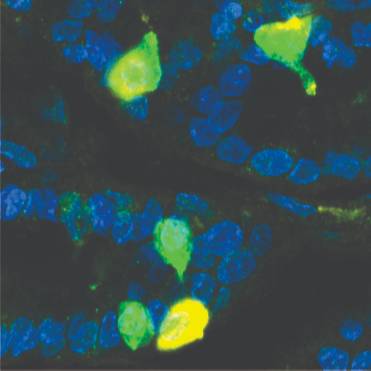
Dataset Overview
Study Purpose: In this study, we have investigated markers for each of the classes of gastric endocrine cells, gastrin, ghrelin, somatostatin, 5-hydroxytryptamine, and histidine decarboxylase, and PYY cells in pig stomach.
Data Collection: This dataset contains images and analysis used to quantify the number and colocalization of various types of endocrine cells in the pig fundus, corpus, and antrum.
Primary Conclusion: None stated.
Curator's Notes
Experimental Design: Pigs were sedated with a xylazine and ketamine mix and euthanized by cardiac injection of pentobarbital sodium (150 mg/kg). Tissues for hematoxylin and eosin staining and immunohistochemistry were removed, opened along the mesenteric border, and pinned flat (mucosa up) without being stretched. Sections for cell counts were imaged as tile scans with a nominal optical thickness of 7.7 μm using a 10x objective on the LSM800 confocal microscope (Zeiss). A 1.5 mm wide region from each imaged section, which contained the full thickness of the mucosa, was selected for analysis in Fiji (http://imagej.nih.gov/ij/). See code /Quantification_macro.ijm and readme.txt file for analysis method.
Completeness: This dataset is a part of a larger study: "Detailed analysis of the intrinsic and extrinsic nerves innervating the pig stomach"
Subjects & Samples: Female (n=4) Large White/Landrace crossbred pigs (Sus scrofa, age unknown) were used in this study. Samples were collected from three gastric regions: antrum, corpus, and fundus.
Primary vs derivative data: Primary data is organized by subject ID with sample IDs indicating tissue region and pig identifier. Primary confocal microscopy images are stored as .czi files with associated RoiSet.zip files containing ROIs for enteroendocrine cells (unnamed ROIs), mucosal areas analyzed ("Mucosa", "Basal", "Middle", "Luminal"), and background regions ("Background"). Derivative data folder contains Excel "Results_" files with mean pixel intensity data for all cells in all channels to determine marker positivity. The "Results" sheet summarizes thresholded results for each animal, standardizes data to total mucosal area, and shows percentage hormone colocalization. Data are summarized in "Quantification_summary.xlsx" and transferred to "Quantification_graphs.pzf" (GraphPad) for graph generation. Primary .czi images were converted with 20:1 compression to JPEG2000 (.jpx) by MBF Bioscience using MICROFILE+ for web streaming and visualization on the SPARC Data Portal, and converted with lossless compression to OME-TIFF (.tif) by MBF Bioscience using MICROFILE+. These converted images are stored in the derivative data folder.
Important Notes: Use ImageJ to open composite images ("_Comp.tif" files) and ROI files ("_RoiSet.zip") for selected antibody combinations.
Code Availability: Instructions on how to use the code contained in "Quantification_macro.ijm" are described in the readme file. Each part of the code (e.g., "PART 1", "PART 2", "PART 3", and "PART 4") can be run independently by selecting the relevant lines of code and pressing Control+Shift+R.
Files
1 - 0 of 0 files
About this dataset
Publishing history
Cite this dataset
Tags
References
Described by
Fothergill, L. J., Galiazzo, G., Hunne, B., Stebbing, M. J., Fakhry, J., Weissenborn, F., Fazio Coles, T. E., & Furness, J. B. (2019). Distribution and co-expression patterns of specific cell markers of enteroendocrine cells in pig gastric epithelium. Cell and Tissue Research, 378(3), 457–469. https://doi.org/10.1007/s00441-019-03065-z
Is Supplemented by
J. Fothergill, L., Stebbing, M., Hunne, B., Galiazzo, G., Fahkry, J., Weissenborn, F., Fazio Coles, T., & B. Furness, J. (2019). Immunohistochemistry and high resolution microscopy of pig gastric enteroendocrine cells v1. https://doi.org/10.17504/protocols.io.4vngw5e

Copyright © 2026 University of Pennsylvania. All rights reserved.