Quantitative analysis of enteric neurons containing choline acetyltransferase and nitric oxide synthase immunoreactivities in the submucosal and myenteric plexuses of the porcine colon
Quantitative study assessing choline acetyltransferase and nitric oxide synthase immunoreactivities in the submucosal and myenteric plexuses of the porcine colon. Regions of the porcine colon analyzed were ascending and descending colon.
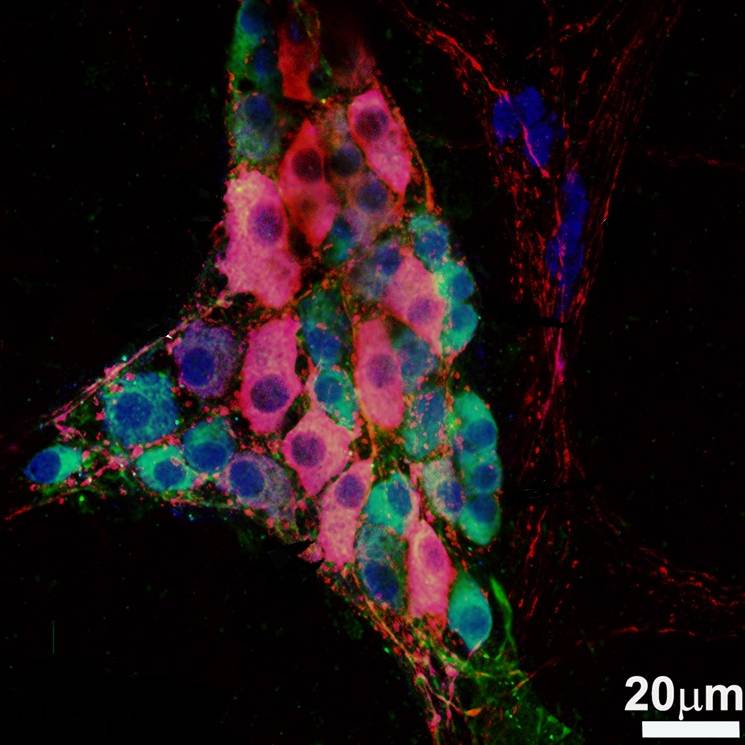
Dataset Overview
Study Purpose: A quantitative study assessing choline acetyltransferase and nitric oxide synthase immunoreactivities in the submucosal and myenteric plexuses of the porcine colon. Regions of the porcine colon analyzed were ascending and descending colon.
Data Collection: This study quantifies enteric neurons in the inner (ISP) and outer(OSP) submucous plexus and a myenteric plexus (MP) of the pig ascending (AC) and descending colon (DC) using the HuC/D, choline acetyltransferase (ChAT), and neuronal nitric oxide synthase (nNOS) neuronal markers in wholemount preparations with multiple labeling immunofluorescences.
Primary Conclusion: We established that the ISP contains the highest number of HuC/D neurons/mm2, which were more abundant in AC vs. DC, followed by OSP and MP with similar density in AC and DC. In the ISP, the density of ChAT immunoreactive (IR) neurons was very similar in AC and DC (31% and 35%), nNOS-IR neurons were less abundant in AC than DC (15% vs. 42%, P< 0.001), and ChAT/nNOS-IR neurons were 5% and 10%, respectively. In the OSP,39-44% of neurons were ChAT-IR in AC and DC, while 45% and 38% were nNOS-IR and 10- 15% were ChAT/nNOS-IR (AC vs. DC P< 0.05). In the MP, ChAT-IR neurons were 44% in AC and 54% in DC (P< 0.05), nNOS-IR neurons were 50% in both, and ChAT/nNOS-IR neurons were 12 and 16%, respectively. The ENS architecture with multilayered submucosal plexuses and the distribution of functionally distinct groups of neurons in the pig colon is similar to humans, supporting the suitability of the pig as a model and providing the platform for investigating the mechanisms underlying human colonic diseases.
Curator's Notes
Experimental Design: Specimens were obtained from 12 hour-fasted Yucatan minipigs (average weight 25-30 Kg of body weight, 15 male, castrated). These animals were first used for colonic motility analysis with manometry probes apposed on the serosa, then tissues were collected 10-20 cm distally 5 hours post-induction of anesthesia. The ascending colon (AC) in correspondence to the central flexure and descending colon (DC) (about 30 cm from the anus) were collected. Wholemount preparations of the myenteric plexus (MP) were obtained by separating the longitudinal muscle layer with attached MP from the submucosa and mucosa using a dissecting microscope. The mucosa was removed from the submucosa and the submucosal layer was separated into the inner (ISP) and outer (OSP) parts of the submucosal plexus. Following the immunostaining protocol, specimens were examined using Zeiss LSM 880 Fast-Airyscan confocal microscope (RRID:SCR_020925) and the Imaris software (Imaris for Neuroscientists, RRID:SCR_007370) for quantification. The total number of neurons in each plexus and the distribution of subclasses of neurons, HuC/D, ChAT, and nNOS positive neurons were counted.
Completeness: This dataset is a part of a larger study pertaining to nerve stimulation on colonic motility in Yucatan minipigs.
Subjects & Samples: Young adult male (n=15) Yucatan pigs (RRID:NSRRC_0012), 25 - 30 kilograms, were used for this study.
Primary vs derivative data: Primary data is organized by the subject ID into the sample and then particular imaging session subfolders. Each imaging folder contains source microscopy images in .CZI format. Derivative folder contains tabularized quantification of immunoreactive neurons expressed as a number of neurons per square mm summarized for all taken images. Image data (JPEG2000 and OME-TIFF) was derived from primary images (.CZI) and is organized by subject ID. CZI images were converted with lossless compression to JPEG2000 (.jp2) and OME-TIFF (.tif) by MBF Bioscience for web streaming and visualization on the SPARC Data Portal.
Files
1 - 0 of 0 files
About this dataset
Publishing history
Cite this dataset
Tags
References
Is Supplemented by
Mazzoni, M., Caremoli, F., Cabanillas, L., de los Santos, J., Million, M., Larauche, M., Clavenzani, P., De Giorgio, R., & Sternini, C. (2020). Quantitative analysis of enteric neurons containing choline acetyltransferase and nitric oxide synthase immunoreactivities in the submucosal and myenteric plexuses of the porcine colon v1. https://doi.org/10.17504/protocols.io.bfqmjmu6
Described by
Mazzoni, M., Caremoli, F., Cabanillas, L., de los Santos, J., Million, M., Larauche, M., Clavenzani, P., De Giorgio, R., & Sternini, C. (2020). Quantitative analysis of enteric neurons containing choline acetyltransferase and nitric oxide synthase immunoreactivities in the submucosal and myenteric plexuses of the porcine colon. Cell and Tissue Research, 383(2), 645–654. https://doi.org/10.1007/s00441-020-03286-7

Copyright © 2026 University of Pennsylvania. All rights reserved.