An interactive system to visualize propagating vagal nerve activity in response to gastric electrical stimulation for gastroparesis
Created through BioCom Laboratory at Purdue University, this interactive GUI can be used to visualize electrode placement and propagating cervical vagus nerve activity tied to gastric electrical stimulation.
Dataset Overview
Study Purpose: Intended for a broad audience with an interest in neuromodulation, this section details background information regarding gastroparesis, gastric electrical stimulation (GES), and the motivation behind visualization of vagal nerve activity in patients receiving GES for gastroparesis. This interactive GUI’s main purpose is to enable comprehensible visualization of body surface potentials (BSPs) and identification of propagating nerve activity collected using a multi-electrode array (MEA) in response to gastric electrical stimulation (GES). Arranged in ordered tabs, users can sequentially view the purpose of the study, subject demographics, neck measurements and calculated data used to determine electrode placement, and BSPs linked to GES.
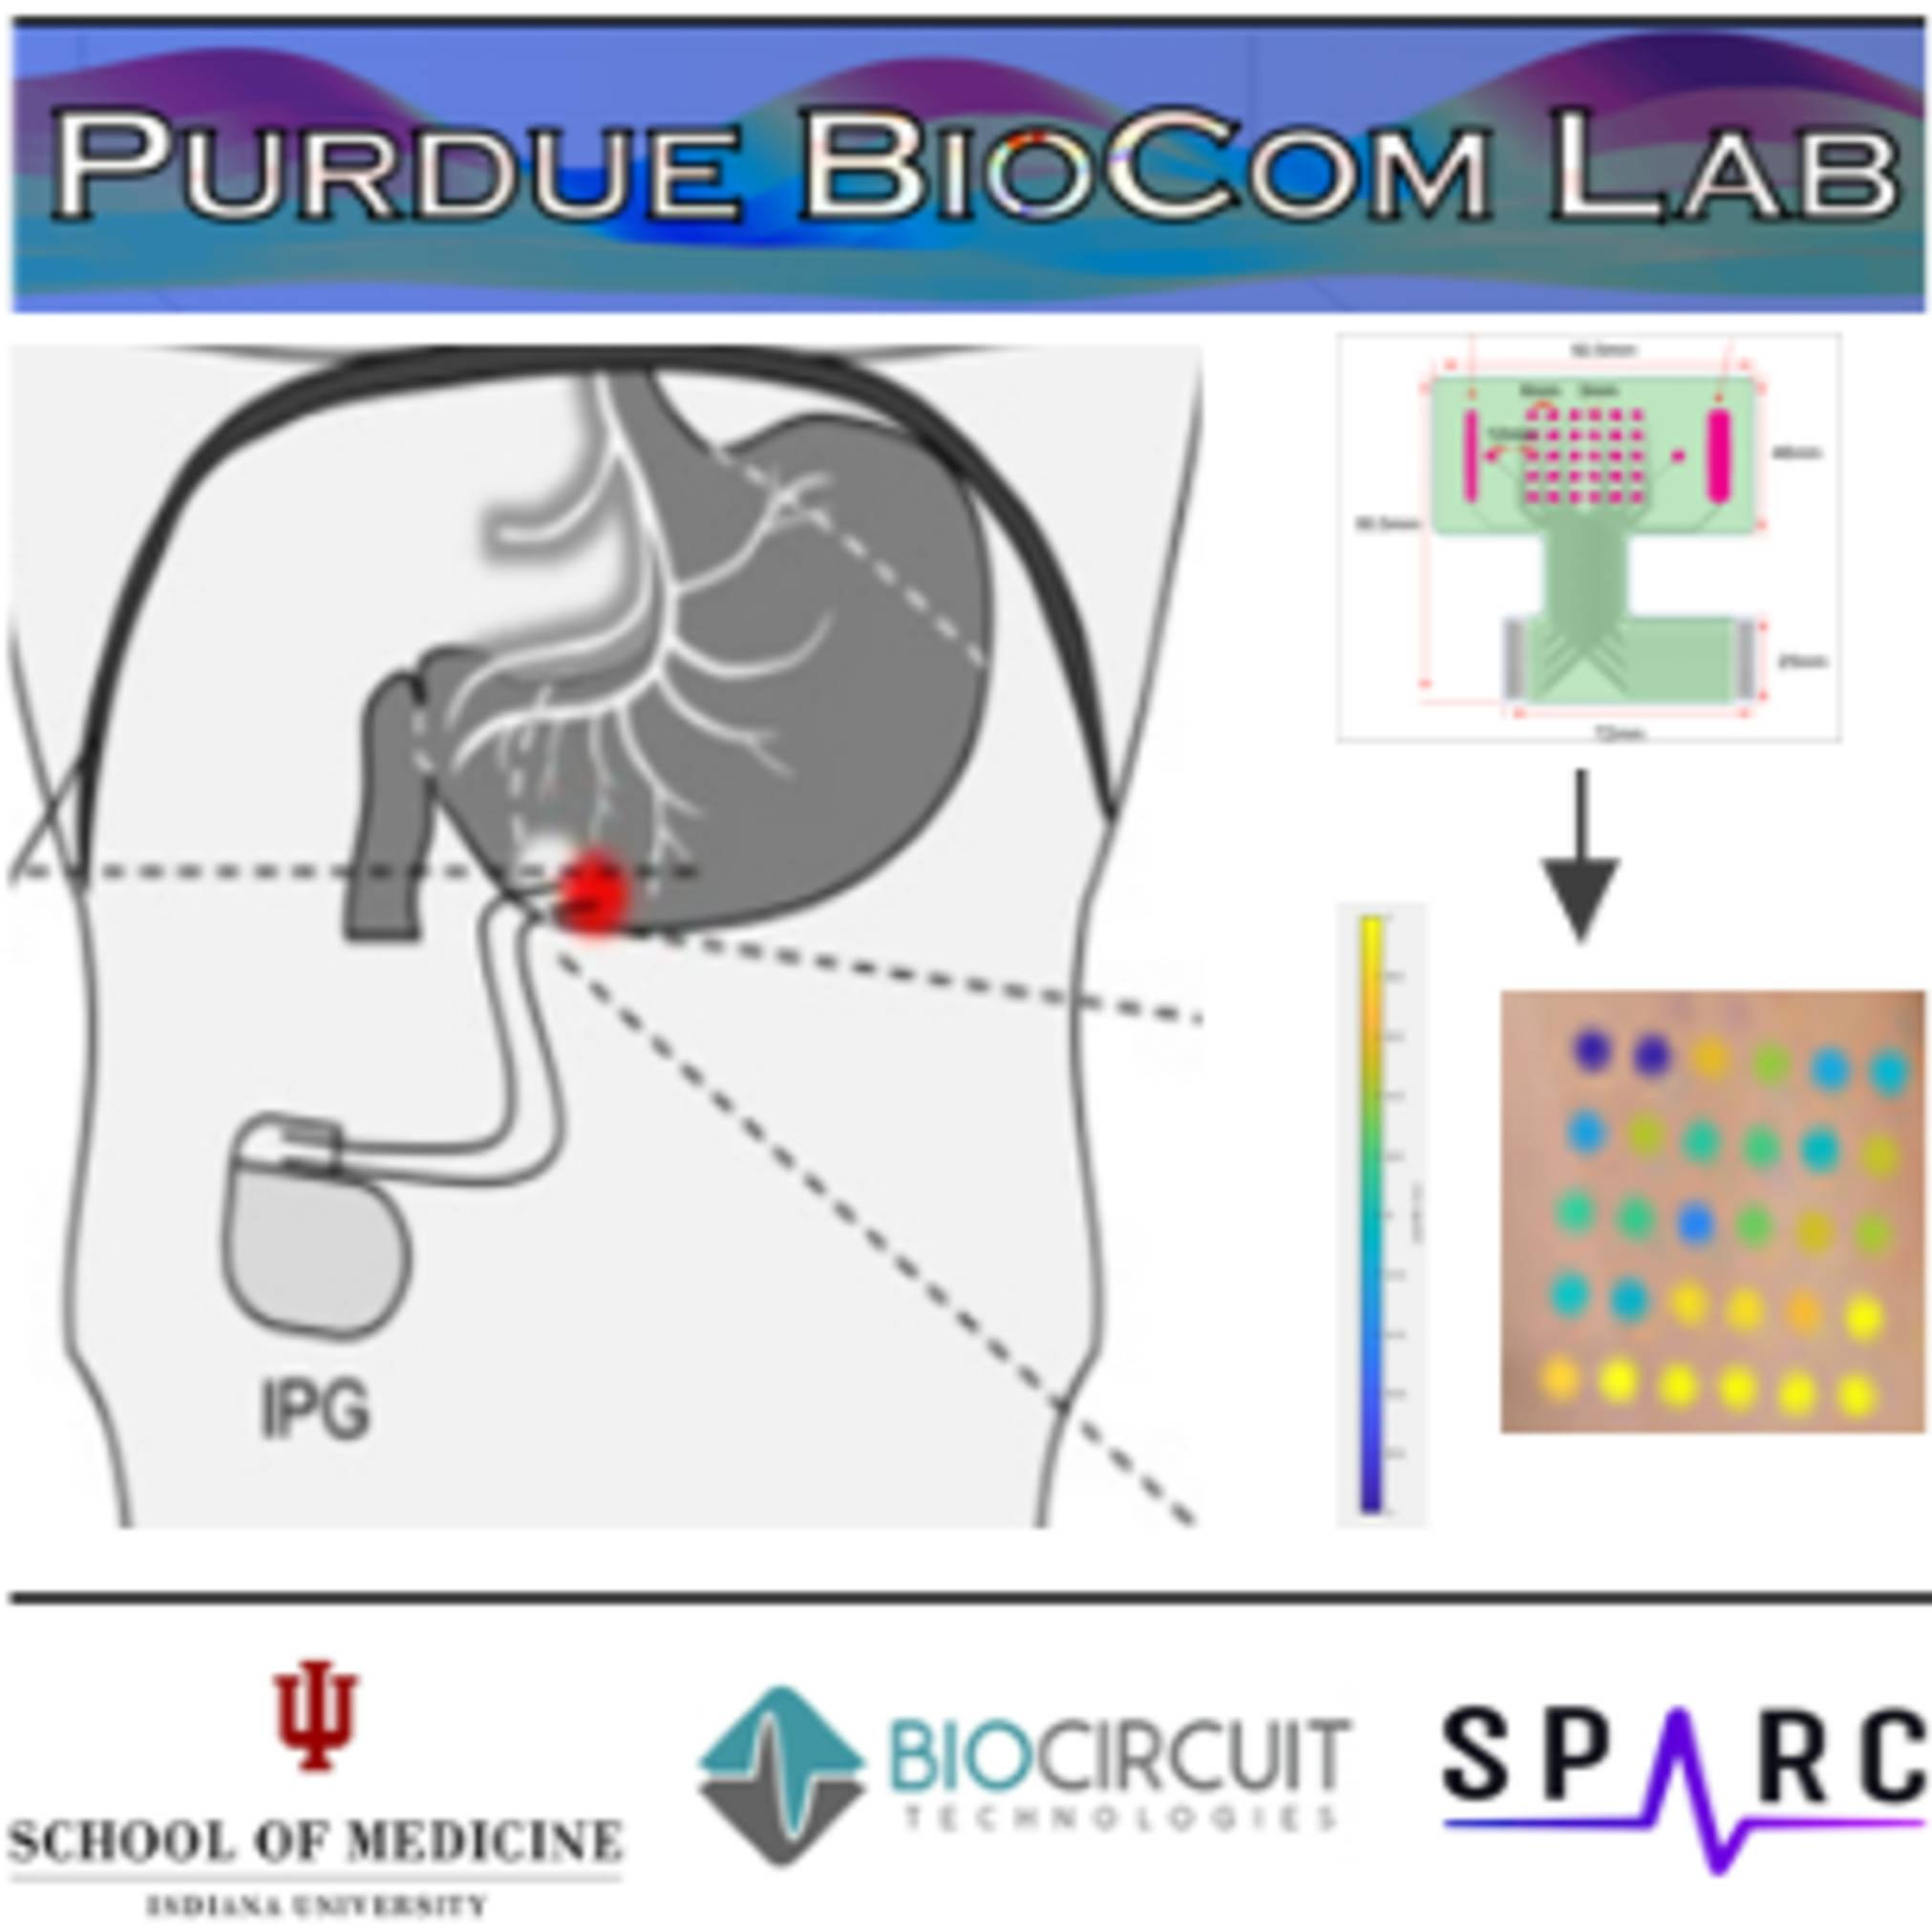
Data Collection: Vagal nerve recordings were obtained in human subjects receiving GES for gastroparesis using a novel, non-invasive method, consisting of placing a 5x6 multielectrode array (MAE) on the skin surface overlying the left and right cervical vagus nerves. Demographic data and neck measurements were also obtained.
Usage Notes: A breakdown of each tab and their interactive components is given below:
Subject Demographics: Subject demographics are displayed in a table. Information presented in the table includes subject ID, gender, age, race, ethnicity, height (cm), weight (kg), body mass index (kg/m²), and etiology for each of the five subjects.
Neck Measurements: This tab displays a color-coded outline of the measurements on an image as well as a description of each measurement in terms of its anatomical position and a table of the cervical measurements obtained for each subject. It also includes an interactive component - users can select and view each measurement by checking/unchecking the boxes.
Calculated Data: Shows an image of the calculated data used to determine MEA placement for each of the subjects.
MEA Placement & Vagal Nerve Activity: This section allows for visualization of MEA placement and vagal nerve activity. Select a subject to view MEA placement on the image. The selected subject’s body mass index is displayed in a table. Additional notes may display depending on the subject selected. Check the ‘Show Vagus Nerve Activity’ box to view activity, a colorbar, and time in milliseconds. The current setting is set to show about 15 milliseconds or 240 frames worth of data. Either prior to or during visualization of vagal nerve activity, the frame rate can be adjusted by selecting the button corresponding to the desired number. Speed of video increases with increasing numbers. To view MEA placement for another subject, uncheck ‘Show Vagus Nerve Activity’ and select another subject. Then click ‘Show Vagus Nerve Activity’. To view nerve activity for another subject, select a subject while the check box ‘Show Vagus Nerve Activity’ is checked.
Curator's Notes
Experimental Design: This is a computational study.
Completeness: Complete.
Subjects & Samples: Data obtained from five adult female human subjects were used in this study.
Primary vs derivative data: Not applicable. This is a computational study, and no primary data was collected.
Code Availability: all files required to run GUI can be found in the code folder.
Files
1 - 0 of 0 files
About this dataset
Publishing history
Cite this dataset
Tags
References
References
Coimbatore, R., Nowak, T., McKinnon, M., Clements, I., & Ward, M. (2021). An Interactive System for Visualizing and Interpreting Propagating Vagal Nerve Activity to Improve the Efficacy of Gastric Electrical Stimulation for Gastroparesis. The FASEB Journal, 35(S1). Portico. https://doi.org/10.1096/fasebj.2021.35.s1.03038
Is Supplement to
Ward, M. P., Gupta, A., Wo, J. M., Rajwa, B., Furness, J. B., Powley, T. L., & Nowak, T. V. (2020). An emerging method to noninvasively measure and identify vagal response markers to enable bioelectronic control of gastroparesis symptoms with gastric electrical stimulation. Journal of Neuroscience Methods, 336, 108631. https://doi.org/10.1016/j.jneumeth.2020.108631

Copyright © 2026 University of Pennsylvania. All rights reserved.